NASA Visualization Shows Earths Rising Seas In Unprecedented Detail
It is one thing to hear that sea levels are rising. It is another thing entirely to watch it happen before your eyes.
A new NASA visualization is doing exactly that. From the perspective of a boat’s porthole gently bobbing at sea, viewers see the ocean slowly climb higher year after year. There are no dramatic explosions or cinematic music. Just water. Gradually, persistently, undeniably rising.
Between 1993 and early 2023, global average sea level rose by nearly 10 centimeters, or about 3.8 inches. That may sound modest at first glance. But according to NASA, the rate and scale of this increase are unprecedented over the past 2,500 years. When seen compressed into a short animation spanning three decades, the effect is striking. It transforms abstract statistics into something far more personal and immediate.
The visualization is not a prediction. It is a record. It captures real satellite data collected over 30 years, revealing a steady upward trend that shows little sign of slowing. And behind those rising numbers lies a complex and deeply interconnected climate story.
A Visualization That Makes The Invisible Visible
For decades, scientists have measured global mean sea level using satellite altimeters. These instruments bounce radar signals off the ocean’s surface to calculate its height. Since 1993, a continuous record has been maintained by a series of international satellites, creating one of the clearest long term indicators of climate change.
NASA’s Scientific Visualization Studio transformed that data into an animation that feels almost deceptively simple. The viewer sees measurement markings along the side of a boat window. As the years tick by, the waterline inches upward. When played on a properly scaled display, those markings are accurate to real world measurements.
The animation shows not only the steady climb but also the small seasonal fluctuations that occur each year. Sea level rises slightly during late summer and early autumn and dips during winter and early spring. These annual ups and downs, which average about two centimeters globally, are driven by seasonal warming and cooling of the oceans and by changes in how much water is temporarily stored on land.
But when viewed over the full three decade span, those seasonal rhythms are overshadowed by a much stronger signal. The long term trend points upward. Persistently.
Why The Ocean Is Expanding
One of the main drivers of rising seas is something that happens at the molecular level. As the planet warms due to greenhouse gases accumulating in the atmosphere, the oceans absorb more than 90 percent of the excess heat trapped in the climate system.
Water expands when it warms. This process, known as thermal expansion, has accounted for roughly half of the observed sea level rise over the past century. Since the early 1990s, the oceans have been gaining an average of about seven zettajoules of heat each year. To put that into context, global human energy consumption each year is only a fraction of that amount.
As this heat builds up, it causes seawater to occupy more space. The expansion does not require additional water to enter the ocean. It simply takes up more volume. Multiply that effect across the vastness of the world’s oceans and the cumulative impact becomes enormous.
Thermal expansion also has another consequence. Warmer water accelerates the melting of ice sheets and glaciers by eroding them from below. This creates a feedback loop in which warming drives both expansion and increased ice loss, amplifying sea level rise.
The Rapid Loss Of Land Ice
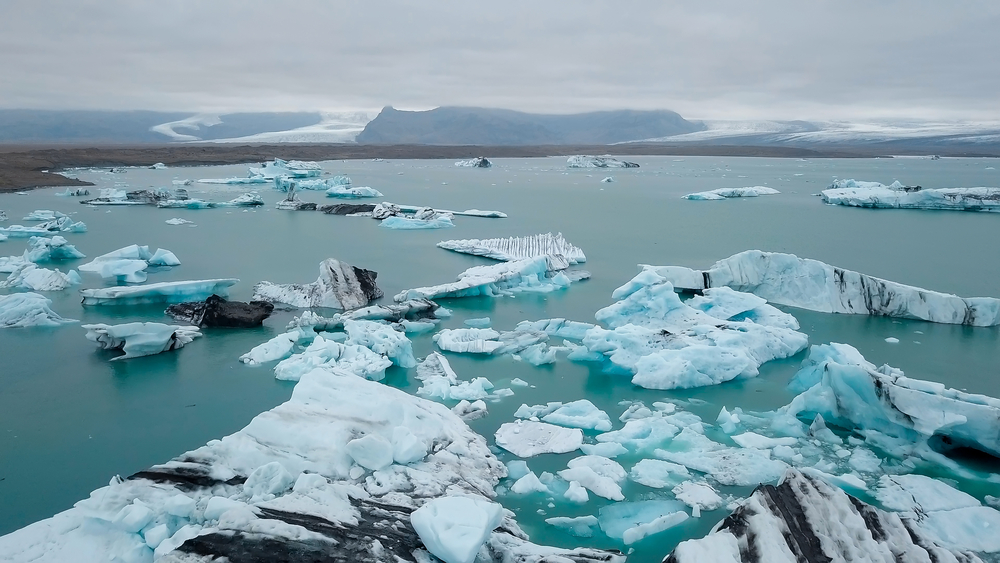
The second major contributor to rising sea levels is the addition of water from melting land ice. Glaciers and ice sheets in Greenland and Antarctica store vast quantities of frozen freshwater. As global temperatures climb, these frozen reservoirs are shrinking at an accelerating pace.
Greenland alone is currently losing roughly 270 billion metric tons of ice each year. Antarctica is shedding about 150 billion metric tons annually. Each metric ton is equivalent to around 1,000 liters of water. Combined, the annual ice loss from these two regions adds enough water to raise global sea levels by nearly 1.2 millimeters every year.
Over time, those millimeters accumulate. Since 1900, global sea levels have risen by more than 20 centimeters. Between 1993 and 2022 alone, researchers have documented approximately 90 millimeters of rise, with about 60 percent of that increase attributed to growing ocean mass from melting ice.
Scientists track these changes using advanced satellite missions. The Gravity Recovery and Climate Experiment, known as GRACE, and its successor GRACE Follow On, measure subtle shifts in Earth’s gravity field. When large masses of ice disappear, the gravitational pull in those regions weakens slightly. By monitoring these variations, researchers can calculate how much ice has been lost.
More recently, scientists have extended the record of ocean mass change back to 1993 using satellite laser ranging techniques. By firing precise laser pulses between satellites and ground stations, they can measure tiny variations in distance and gravity that reveal how much water has been added to the oceans. This approach has produced the first direct 30 year record of global ocean mass change, confirming that ice loss has become the dominant driver of sea level rise since around 2005.
The Natural Ups And Downs That Mask A Bigger Trend
Sea level rise is not a perfectly straight line. Natural climate variability introduces temporary fluctuations that can obscure the broader pattern.
Events such as El Niño and La Niña alter ocean temperatures and global rainfall patterns. During El Niño years, warmer ocean conditions and shifts in precipitation can temporarily boost global sea levels. During La Niña, increased rainfall over land and cooler ocean temperatures can cause temporary dips.
For example, satellite records show noticeable spikes in sea level during the strong El Niño events of 2015 to 2016 and again in 2022 to 2023. Conversely, a pronounced drop occurred between 2010 and 2011 due to La Niña. Yet despite these swings, the underlying upward trajectory remains dominant.
This interplay between short term variability and long term change can sometimes create confusion in public discussions. A single year of slower growth does not reverse decades of cumulative rise. The NASA visualization makes this clear by presenting the full context. Seasonal and yearly fluctuations appear as small ripples superimposed on a steadily rising baseline.
A New Era Of Ocean Measurement
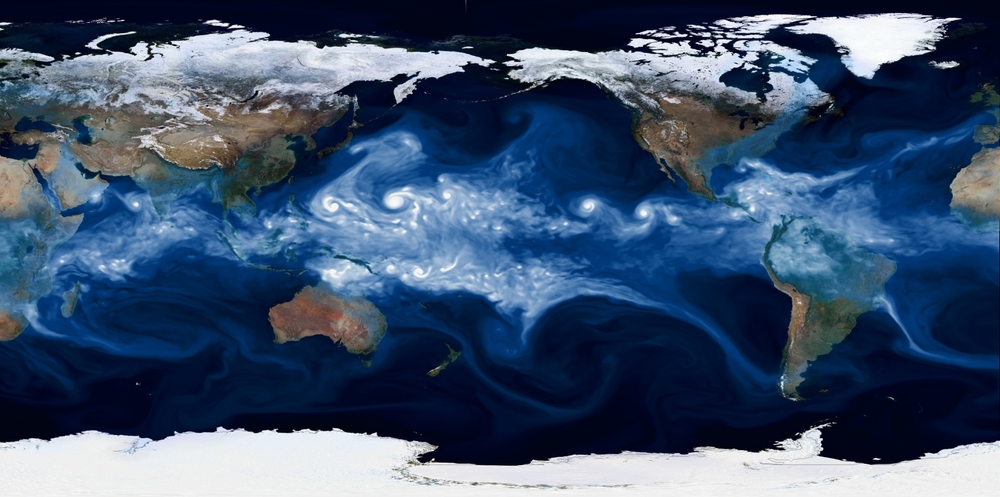
Understanding sea level rise requires not only measuring the height of the ocean surface but also mapping how water is distributed across the planet.
The international Surface Water and Ocean Topography mission, known as SWOT, represents a significant leap forward in this effort. Led by NASA and the French space agency CNES, the satellite uses a Ka band Radar Interferometer instrument to measure water elevation across wide swaths of Earth’s surface.
Traditional altimeters observe a narrow beam directly beneath the satellite. SWOT, by contrast, captures two dimensional maps spanning about 120 kilometers across. Its spatial resolution is roughly ten times greater than earlier composite measurements.
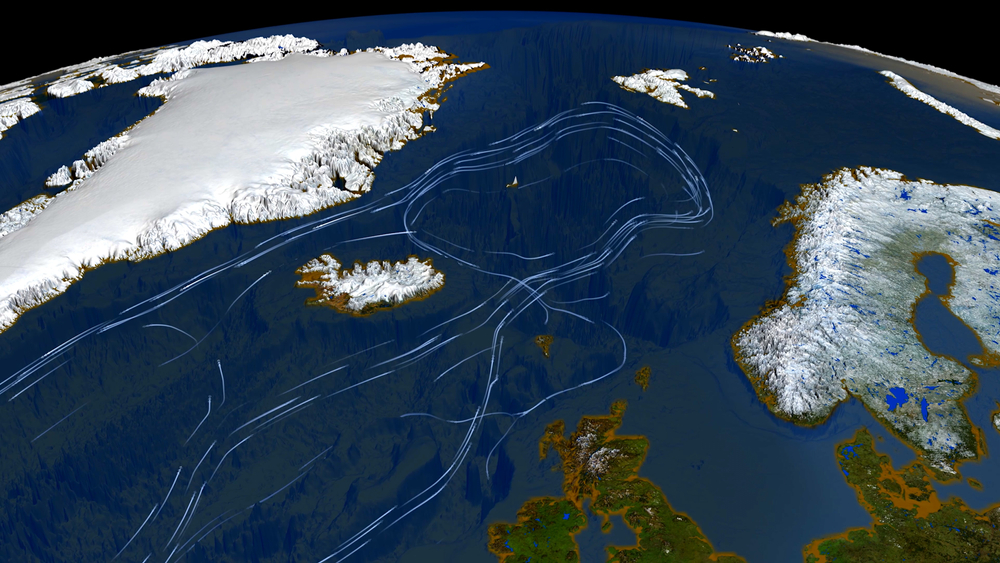
Early images from SWOT have revealed detailed views of ocean currents such as the Gulf Stream off the east coast of the United States, as well as freshwater features on Long Island and elsewhere. The mission can measure lakes, rivers, and reservoirs as small as about 100 meters wide, offering one of the most comprehensive surveys of surface water ever attempted.
These data are freely available and are expected to play a critical role in climate research, water resource management, and disaster preparedness. By improving our understanding of how water moves and accumulates, scientists can refine models that project future sea level rise and flood risk.
What Rising Seas Mean For Communities
The numbers in NASA’s visualization may seem abstract, but their consequences are anything but.
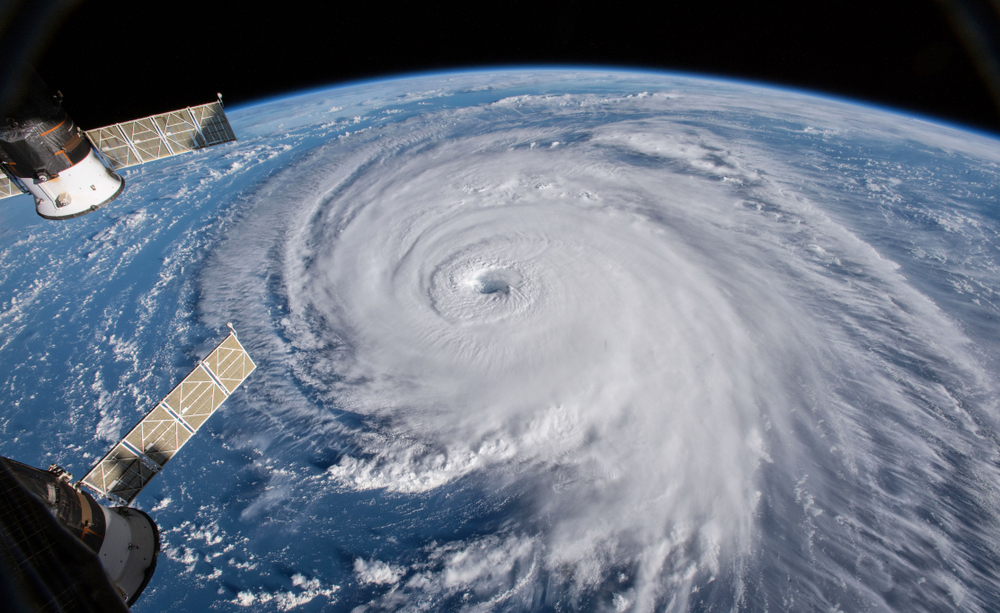
Coastal regions and low lying areas are already experiencing the impacts of higher baseline sea levels. Even small increases can amplify the reach of storm surges, allowing floodwaters to penetrate farther inland. Tidal flooding, sometimes called nuisance flooding, is becoming more frequent in many coastal cities.
As sea levels continue to rise, the risks compound. Infrastructure such as roads, ports, and wastewater systems may require costly upgrades. Saltwater intrusion can threaten drinking water supplies and agricultural land. Natural ecosystems, including wetlands and mangroves, face pressure as they struggle to adapt to changing shorelines.
The challenge is not evenly distributed. Some communities, particularly in developing nations and small island states, face disproportionate exposure and have fewer resources for adaptation. In these regions, sea level rise is not a distant concern but a present reality that shapes daily life.
At the same time, the story is not solely one of vulnerability. Advances in measurement and modeling are equipping policymakers with better information than ever before. With accurate projections, communities can design protective infrastructure, restore natural buffers, and implement zoning strategies that reduce long term risk.
The Acceleration Factor

One of the most concerning findings from recent research is not just that sea levels are rising, but that the rate of rise itself is increasing.
Over the past three decades, global mean sea level has risen at an average rate of about 3.3 millimeters per year. More importantly, that rate has been speeding up. As ice sheets lose mass more rapidly and ocean heat content continues to climb, the contribution from melting land ice has grown larger relative to thermal expansion.
Studies show that since the mid 2000s, ocean mass increase from ice loss has become the primary driver of rising seas. Melting from polar ice sheets and mountain glaciers accounts for more than 80 percent of the total increase in ocean mass over the full study period.
Acceleration matters because it complicates planning. A steadily rising trend can be projected with relative confidence. An accelerating trend requires constant reassessment and adaptation. The more quickly emissions drive warming, the faster these changes unfold.
Seeing The Bigger Picture
The NASA visualization has resonated widely because it translates complex climate science into a simple, visual narrative. Watching the waterline climb invites a different kind of engagement than reading a graph or a report.
It also underscores the importance of sustained scientific observation. Without decades of satellite data, the story would be far less clear. Continuous monitoring allows researchers to distinguish between natural variability and human driven change, to identify acceleration, and to validate climate models used for future projections.
In many ways, the animation is both a warning and a testament to scientific progress. It shows the tangible consequences of greenhouse gas emissions, but it also demonstrates humanity’s capacity to measure and understand planetary scale transformations.
A Moment For Reflection
Nearly four inches of global average sea level rise since 1993 may not seem dramatic when imagined as a single measurement. But when distributed across the world’s oceans, affecting every coastline and magnifying the power of storms, it becomes a defining feature of our era.
The causes are clear. The oceans are warming as they absorb excess heat. Ice sheets and glaciers are melting as global temperatures rise. The added water and expanding seawater combine to push the shoreline outward.
The trajectory is also clear. Despite seasonal fluctuations and temporary dips, the long term trend continues upward. And the rate of rise is increasing.
NASA’s visualization does not shout. It does not rely on dramatic narration or alarming graphics. It simply shows the data. In doing so, it offers something both sobering and empowering. Sobering because the change is real and ongoing. Empowering because understanding is the first step toward response.
Sea level rise is not a distant abstraction. It is measurable, visible, and accelerating. The waterline in that porthole will continue to climb unless the forces driving it are addressed.
The question that remains is not whether the seas are rising. It is how humanity chooses to respond to what is now unmistakably clear.
Featured Image Source: Shutterstock