Scientists Just Released A Map Of 2.75 Billion Buildings Worldwide And Your Home Is Likely On It
At first glance, the idea sounds almost unbelievable. A single interactive map that documents nearly every physical structure humans have built across the entire planet feels closer to science fiction than academic research. Yet university researchers have now done exactly that, creating a global dataset that captures homes, apartment blocks, offices, factories, warehouses, and even isolated rural sheds scattered across deserts, mountains, and farmland. From dense megacities to sparsely populated regions, the map offers an unprecedented look at how deeply human construction has reshaped the Earth’s surface.
What makes this achievement especially striking is not just its sheer scale, but what it represents about modern life. Buildings are one of the most visible and lasting indicators of human presence, shaping how societies organize, grow, and distribute resources. Until now, no tool has been able to show this reality at a truly global level and in three dimensions. By freezing the built world as it existed in 2019, the new map allows scientists, policymakers, and the public to step back and see the physical footprint of humanity in its entirety, while quietly raising questions about inequality, urban growth, and how much of the planet remains untouched.
Blog | La prima mappa 3D di quasi tutti gli edifici della Terra – Info Data https://t.co/jqbLmzCUDR pic.twitter.com/7PwAqVl6ta
— IlSole24ORE (@sole24ore) December 22, 2025
A Global Atlas Built From Satellite Imagery
The project, called the GlobalBuildingAtlas, was created by university researchers who combined more than 800,000 satellite images captured in 2019 with advanced machine learning tools. These images were processed by AI models trained to distinguish buildings from natural features like trees, roads, and terrain, allowing the system to identify structures in environments ranging from dense city centers to remote rural regions that are often overlooked by traditional mapping efforts.
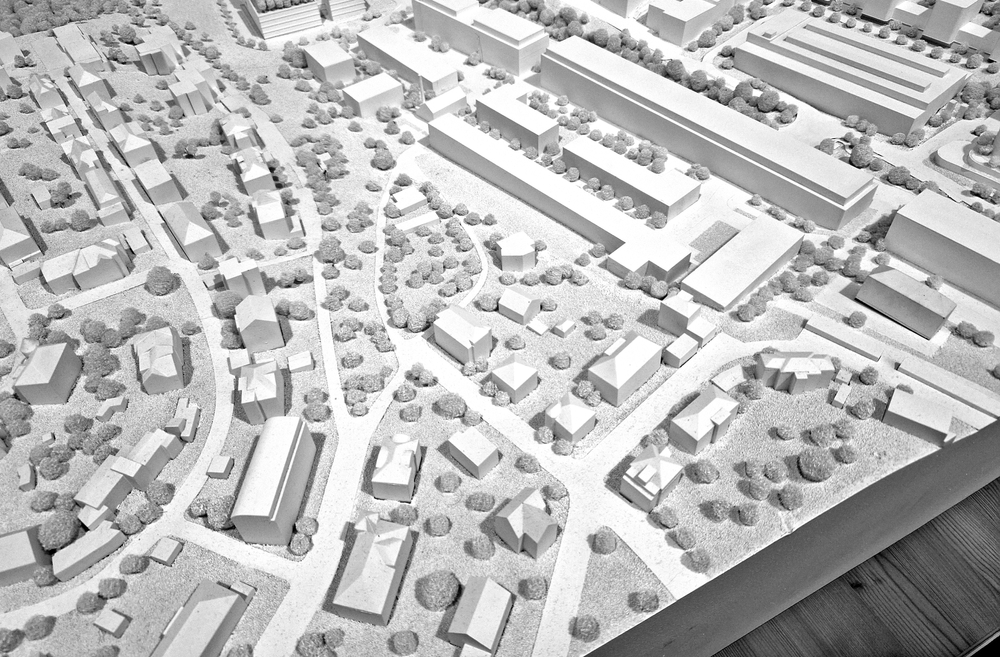
Unlike earlier global building datasets that focused primarily on flat outlines, this atlas estimates the height and total volume of each structure, as well as the distance between neighboring buildings. This means the map does not simply show where buildings exist, but how they occupy space in three dimensions, offering a far more realistic picture of settlement patterns across the world. Rural villages, informal housing areas, suburban developments, and towering city skylines are all captured using the same consistent methodology.
The scale of the dataset is unprecedented. The GlobalBuildingAtlas contains approximately 2.75 billion buildings, which is more than a billion additional structures compared to any previous global database. It also offers roughly 30 times more detail than existing 3D building models, all achieved without the need to deploy expensive ground scanning aircraft. Instead, the researchers relied entirely on existing satellite data and sophisticated AI techniques.
This combination of accessibility and depth means the atlas is not just a visual curiosity, but a foundational resource for researchers and decision makers seeking to understand how humanity has physically shaped the planet.
The GlobalBuildingAtlas has mapped 2.75 billion buildings in 3D—adding 1 billion structures that were previously invisible to digital maps.
— Singularity Hub (@singularityhub) December 22, 2025
30x higher resolution. 97% global coverage. 100% open data. #AI #3DMap #GlobalImpact https://t.co/1tEjoCQuit
Why Three Dimensional Data Changes How We See Cities
For decades, most global building maps have relied on two dimensional footprints, which only show the surface area a structure occupies. While useful, these flat representations can be misleading, especially in cities where vertical growth defines how people actually live. A single story house and a high rise apartment building might cover the same land area, but they represent completely different population densities, infrastructure demands, and living conditions.
The GlobalBuildingAtlas addresses this limitation by incorporating building height and volume into its analysis. As the project lead explained, “With 3D models, we see not only the footprint but also the volume of each building, enabling far more precise insights into living conditions.” This additional layer of information allows researchers to estimate population density more accurately and better understand how housing and infrastructure are distributed within cities.
Three dimensional data also reveals how urban areas evolve over time. Vertical expansion often signals economic growth, migration pressures, or housing shortages, trends that can be difficult to identify using traditional maps. By capturing these patterns globally, the atlas provides a clearer view of how cities grow, adapt, and sometimes struggle to keep pace with population change.
In practical terms, this means planners and researchers can move beyond surface level observations and begin analyzing the true capacity and stress points of urban environments worldwide.
Incredible map charts all of the world's 2.75 billion buildings in 3D https://t.co/ODbxOq7rd6 pic.twitter.com/9XbA0sFk7D
— Evan Kirstel #B2B #TechFluencer (@EvanKirstel) December 22, 2025
Revealing Inequality Through The Built Environment
One of the most powerful insights offered by the GlobalBuildingAtlas is its ability to highlight inequality through physical structures. Wealthier regions tend to show larger building volumes per person, more open space, and greater separation between buildings. Poorer areas, in contrast, often appear as dense clusters of smaller structures with limited vertical space and little room for expansion.
To better quantify these differences, the researchers introduced a new metric that focuses on space rather than income alone. “We introduce a new global indicator: building volume per capita, the total building mass relative to population – a measure of housing and infrastructure that reveals social and economic disparities,” the project lead said. This indicator provides a tangible way to compare living conditions across regions that may otherwise lack reliable economic data.
Because buildings are physical and measurable, this approach offers insights even in parts of the world where official statistics are incomplete or outdated. The structures themselves tell a story about access to housing, infrastructure investment, and quality of life, often revealing disparities that are hidden behind national averages.
Seen at a global scale, the map makes inequality visible in a way that charts and spreadsheets rarely can, showing how unevenly space and resources are distributed across the planet.
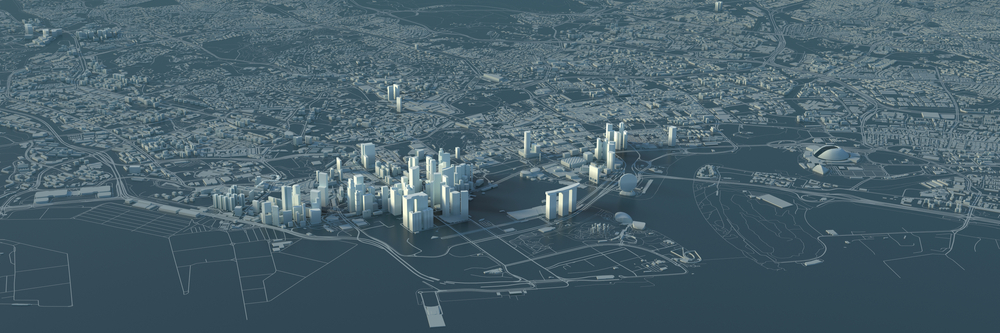
Image Credit: Shutterstock
How Artificial Intelligence Made The Map Possible
Mapping billions of buildings would have been impossible just a decade ago. The GlobalBuildingAtlas relies heavily on advances in artificial intelligence, with researchers spending years training machine learning models to accurately distinguish buildings from roads, vegetation, and other landscape features using satellite imagery alone.
The system estimates building heights by learning from regions where reliable height data already exists, then applying those patterns to areas where direct measurements are unavailable. This approach allowed the team to generate a consistent global model without sending survey planes or teams into every corner of the world, dramatically reducing costs and logistical barriers.
The researchers are open about the limitations of the data. Some high rise buildings are underestimated, and certain regions, particularly parts of Africa, require more training data and validation to improve accuracy. These gaps highlight the challenges of creating a truly global dataset using automated methods.
Even with these imperfections, the atlas remains the most comprehensive and detailed global 3D building map ever produced, setting a new benchmark for what is possible with satellite data and AI.
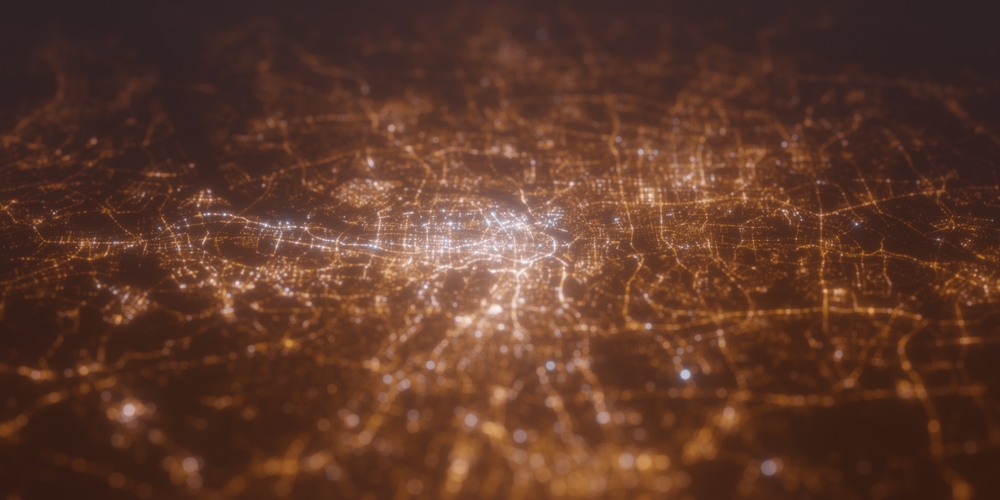
Image Credit: Shutterstock
Planning Cities And Responding To Disasters
The research team hopes the GlobalBuildingAtlas will have a direct impact on real world decision making. Governments and urban planners can use the data to better understand housing density, infrastructure gaps, and patterns of urban expansion, particularly in rapidly growing cities where traditional data collection struggles to keep up.
The atlas also has important applications for disaster preparedness and response. Detailed information about building volume and density can help authorities assess which areas are most vulnerable to floods, earthquakes, and other natural hazards, and plan evacuation routes, emergency housing, and rebuilding efforts more effectively.
As one researcher explained, “3D building information provides a much more accurate picture of urbanization and poverty than traditional 2D maps.” This improved accuracy could help ensure that limited resources are directed to the communities that need them most.
In a world facing increasing climate risks and urban pressure, such insights could prove critical for building more resilient and inclusive cities.
🔴"Ερευνητές δημιούργησαν τον πρώτο παγκόσμιο χάρτη που απεικονίζει 2,75 δισ. κτίρια σε τρεις διαστάσεις
— Mairy Al (@MariaA5632) December 21, 2025
🔴Ο χάρτης παρέχει δεδομένα κρίσιμα για την κλιματική έρευνα, τη βιώσιμη ανάπτυξη και τον σχεδιασμό ανθεκτικών και συμπεριληπτικών πόλεων."
👇 https://t.co/uwnwFGDWP6.
A Snapshot Of The World Frozen In 2019
The atlas captures the global built environment as it existed in 2019, meaning it includes buildings that may since have been altered or demolished and does not reflect construction from recent years. In some cases, this creates unexpected historical records of cities in transition, preserving neighborhoods and structures that may no longer exist.
Rather than viewing this as a weakness, the researchers see it as a baseline. Future updates could allow scientists to track changes in urban development over time, offering a clearer picture of how humanity’s physical footprint continues to expand and evolve.
As the research team wrote, “Buildings anchor human life and define the form and function of urban environments.” Preserving a detailed record of those buildings could help shape better planning and policy decisions in the future.
What The Map Ultimately Asks Us To Reflect On
Since its public launch, hundreds of thousands of people have visited the interactive atlas, often zooming in to find familiar places and explore how their own communities fit into the global picture. For many, the experience is both fascinating and sobering.
Seeing billions of structures spread across the planet highlights the sheer scale of humanity’s presence and how much of the natural world has been reshaped to support modern life. It makes clear that buildings are not just background scenery, but powerful symbols of how societies allocate space, resources, and opportunity.
In showing us nearly every building on Earth, the GlobalBuildingAtlas does more than map structures. It offers a moment of reflection on how we build, where we build, and what kind of future we are creating for the generations that follow.
Featured Image Credit: Shutterstock