Satellites Just Caught Heat Leaking From America’s Biggest Bitcoin Mine
Something massive is humming in central Texas. It consumes enough electricity to power 300,000 homes. It generates heat that can be seen from orbit. And until recently, few people understood what was happening inside. A UK-based satellite company has changed that.
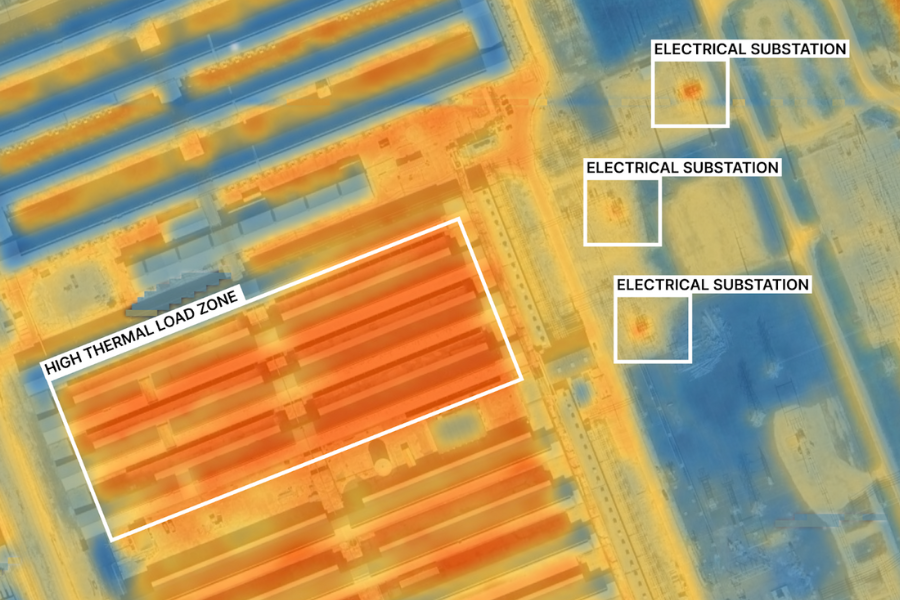
In December 2025, SatVu released an image unlike anything the public has seen before. From hundreds of miles above Earth, their thermal camera captured heat pouring out of a sprawling industrial facility in Rockdale, Texas. Rooftop cooling units glowed with activity. Electrical substations pulsed with energy. Some sections of the campus blazed hot while others remained dark and dormant.
What makes this image so striking is not just what it shows, but what it represents. For years, data centers have grown with minimal outside scrutiny. Companies announce new facilities. Press releases celebrate capacity expansions. But between those announcements and the reality on the ground, a gap has existed. No one outside these operations could verify what was happening, when systems came online, or how much energy they consumed in real time. Now, eyes in the sky are watching.
A Closer Look at Rockdale
SatVu did not name the specific facility in their release. But Rockdale, Texas, houses one operation that fits every description in its announcement. Riot Platforms runs what many consider the largest Bitcoin mining facility in America from this small town east of Austin.
Numbers tell part of the story. Riot’s Rockdale campus demands 700 megawatts of power. For comparison, that figure rivals the electricity consumption of a small city. Bitcoin mining requires enormous computational power, which in turn requires enormous energy, which in turn generates enormous heat. Heat cannot hide.
SatVu’s satellite captured thermal readings at 3.5-meter resolution, meaning each pixel in their image represents a square roughly eleven feet across. At that level of detail, individual pieces of equipment become visible. Rooftop chillers designed to cool server rooms appear distinct from transformers managing electrical loads. Analysts can identify which buildings house active mining operations and which stand idle.
Such precision changes the game for anyone trying to understand how these facilities operate. Heat patterns reveal whether new construction phases have come online. Temperature variations show how energy use shifts throughout a facility over time. Physical evidence replaces corporate messaging as the primary source of truth.
Why Heat Tells the Real Story
Building a data center takes years. Powering one up takes time as well. Companies often announce projects long before operations begin, and expansion plans may proceed more slowly or faster than public statements suggest.
Before thermal satellite imagery, outside observers relied on indirect methods to track these developments. Analysts studied permit applications. Researchers monitored electricity demand patterns. Journalists interviewed local officials. Each approach offered fragments of the picture, but none provided the complete view that a heat map delivers.
Thomas Cobti, VP of Business Development at SatVu, put it plainly when discussing the release. “Today’s data centre buildout is moving incredibly quickly, and the world needs better ways to understand what’s actually happening on the ground. Thermal data gives an objective view of operational activity as it occurs – not weeks later through reports or announcements.”
His words carry weight for multiple audiences. Regulators want to know when large energy consumers affect local power grids. Investors want accurate information about whether facilities meet projected timelines. Environmental groups want verified data about carbon footprints. Communities living near these facilities want transparency about what is being built in their backyards.
Thermal intelligence serves all these interests by showing reality as it happens rather than as companies choose to present it.
Reading the Image Like a Blueprint
Examining SatVu’s Rockdale image reveals operational details that would otherwise remain hidden behind security fences and corporate communications.
Rooftop chillers appear as bright signatures concentrated above buildings where servers generate heat around the clock. Transformers in electrical yards glow according to how much load passes through them. Dormant sections of the campus read cooler, indicating either unused capacity or infrastructure not yet connected to power systems.
SatVu explained the value of combining these layers of information in their announcement. “Together, these layers provide a grounded, evidence-based view of how major data center sites are evolving in real time.”
Such evidence matters because the data center industry has entered a period of explosive growth. Demand for cloud computing continues to rise. Artificial intelligence applications require massive computational resources. Cryptocurrency mining operations expand wherever cheap electricity can be found. Each of these trends pushes data center construction forward at speeds that outpace regulatory frameworks and public awareness.
McKinsey, the global consulting firm, estimates that worldwide investment in data center infrastructure will exceed seven trillion dollars by 2030. American demand alone grows between 20 and 25 percent each year. Numbers on that scale represent a fundamental shift in how societies generate and consume electricity.
Yet until thermal satellites pointed their cameras downward, much of this expansion remained opaque to outside observation.
Bitcoin’s Environmental Shadow
Cryptocurrency mining occupies a controversial position in conversations about energy and climate. Unlike traditional data centers that power applications people use for communication, commerce, and entertainment, Bitcoin mining exists purely to validate transactions and generate new coins. Whether that purpose justifies the energy cost remains a subject of ongoing debate.
Numbers help frame the discussion. Recent research suggests that a single Bitcoin transaction generates as much carbon dioxide as burning gasoline for a 1,600-mile car trip. Globally, data centers contribute roughly half a percent of all carbon emissions. As both AI and cryptocurrency drive data center expansion, that percentage will likely grow.
Critics argue that Bitcoin mining represents one of the least efficient uses of electricity on the planet. Supporters counter that mining operations often locate near renewable energy sources or consume excess power that would otherwise go unused. Thermal satellite imagery cannot resolve this debate, but it can inject verified facts into discussions that have long relied on estimates and corporate claims.
When a satellite can measure heat escaping from a facility, arguments about energy consumption become grounded in physical reality rather than public relations.
SatVu’s Journey and What Comes Next

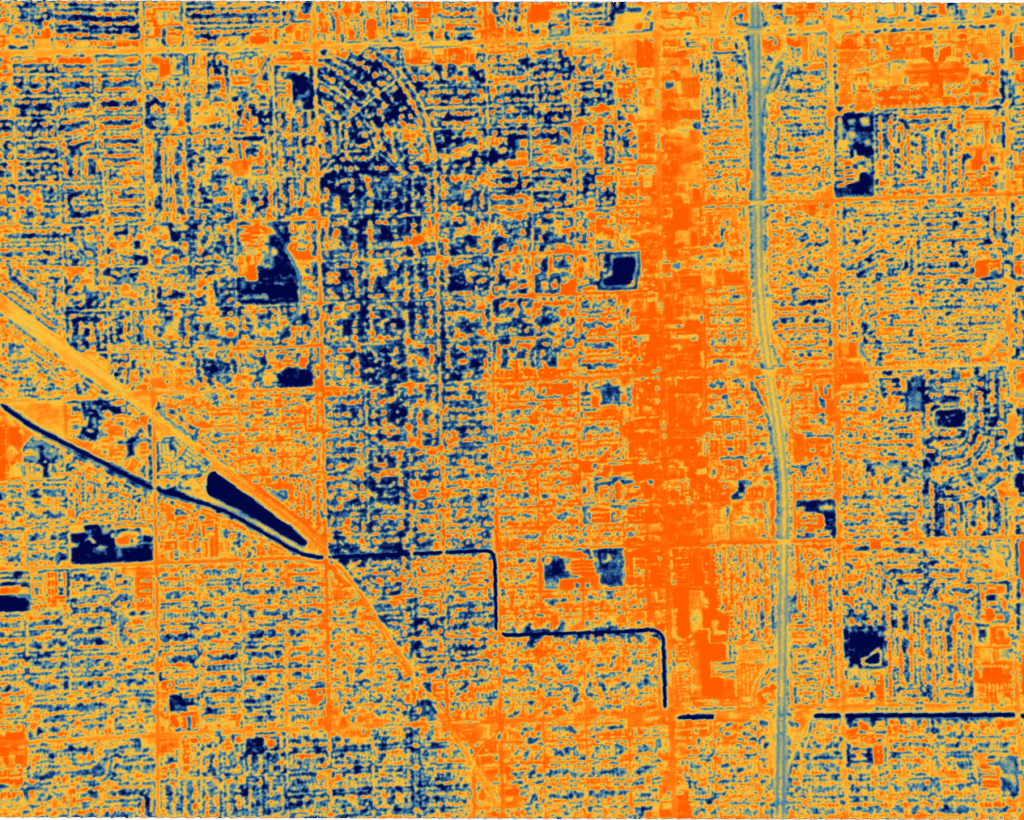
Understanding SatVu’s Rockdale image requires knowing something about the company behind it. SatVu launched its first thermal imaging satellite, HotSat-1, with ambitions to monitor industrial activity worldwide. Early images captured heat trails behind moving locomotives and showed how urban heat islands form in cities like Las Vegas. Their thermal camera offered resolution an order of magnitude better than competing systems in orbit.
However, HotSat-1 failed in December 2023. SatVu released their Rockdale image in December 2025, meaning the capture likely occurred before the satellite malfunction. Despite this setback, SatVu has continued developing its technology. Plans call for launching HotSat-2 in 2026, with HotSat-3 already under construction.
Beyond data centers, SatVu’s technology can monitor blast furnaces in steel production, flaring intensity at oil and gas operations, and activity at cement kilns. Any industrial process that generates heat becomes visible to their satellites. As more thermal sensors reach orbit, the ability to monitor global industrial activity will expand proportionally.
Accountability From Above
For decades, large industrial operations benefited from a form of practical obscurity. Yes, regulators could inspect facilities. Yes, journalists could investigate claims. But systematic, real-time monitoring remained impossible without cooperation from the companies themselves. Satellites change that equation.
A mining company cannot prevent a spacecraft from passing overhead. Heat cannot be hidden or dressed up for inspectors. What happens on the ground becomes visible from space, whether operators want outside observers watching or not.
“At a closer level, it reveals which substations and cooling systems are under load – clear, physical indicators of real operational behavior,” SatVu noted in their statement about the Rockdale image.
Such indicators matter because trust requires verification. When companies claim to use renewable energy, thermal patterns can show whether operations match stated timelines. When facilities promise to limit local grid impact, satellite data can verify those commitments. When expansion plans stall or accelerate, heat signatures tell the story before press releases do.
A Hotter Future
Data centers will continue growing. Artificial intelligence demands computational power that humans have never needed before. Cloud services expand as businesses and consumers move more activity online. Cryptocurrency, despite its critics, shows no signs of disappearing from the financial landscape. All of this growth generates heat. All of that heat can be seen from space.
What SatVu’s Rockdale image represents goes beyond one facility in one Texas town. It signals the arrival of a new form of accountability for industrial operations worldwide. When satellites can measure what happens inside facilities that prefer privacy, the relationship between corporations, regulators, and the public shifts permanently. Eyes in the sky are watching. And what they see, everyone can know.